| collectors | ||
| .gitignore | ||
| .travis.yml | ||
| CONTRIBUTING.md | ||
| Dockerfile | ||
| exporter.go | ||
| LICENSE | ||
| Makefile | ||
| Makefile.COMMON | ||
| README.md | ||
| sample.png | ||
Ceph Exporter 


Prometheus exporter that scrapes meta information about a running ceph cluster. All the information gathered from the cluster is done by interacting with the monitors using an appropriate wrapper over rados_mon_command(). Hence, no additional setup is necessary other than having a working ceph cluster.
Dependencies
You should ideally run this exporter from the client that can talk to Ceph. Like any other ceph client it needs the following files to run correctly.
ceph.confcontaining your ceph configuration.ceph.<user>.keyringin order to authenticate to your cluster.
Ceph exporter will automatically pick those up if they are present in
any of the default
locations. Otherwise you will need to provide the configuration manually using --ceph.config flag.
We use Ceph's official Golang client to run commands on the cluster.
Flags
| Name | Description | Default |
|---|---|---|
| telemetry.addr | Host:Port pair to run exporter on | *:9128 |
| telemetry.path | URL Path for surfacing metrics to prometheus | /metrics |
| ceph.config | Path to ceph configuration file | "" |
Installation
Typical way of installing in Go should work.
go install
A Makefile is provided in case you find a need for it.
Docker Image
It is possible to run the exporter as a docker image. The port 9128 is
exposed for running the default ceph exporter.
The exporter needs your ceph configuration in order to establish communication with the monitors. You can either pass it in as an additional command or ideally you would just mount the directory containing both your ceph.conf and your user's keyring under the default /etc/ceph location that Ceph checks for.
A sample run would look like:
$ docker build -t digitalocean/ceph_exporter .
...
<build takes place here>
...
$ docker run -v /etc/ceph:/etc/ceph -p=9128:9128 -it digitalocean/ceph_exporter
You would need to ensure your image can talk over to the monitors so if
it needs access to your host's network stack you might need to add
--net=host to the above command. It makes the port mapping redundant
so the -p flag can be removed.
Point your prometheus to scrape from :9128 on your host now (or your port
of choice if you decide to change it).
Contributing
Please refer to the CONTRIBUTING guide for more information on how to submit your changes to this repository.
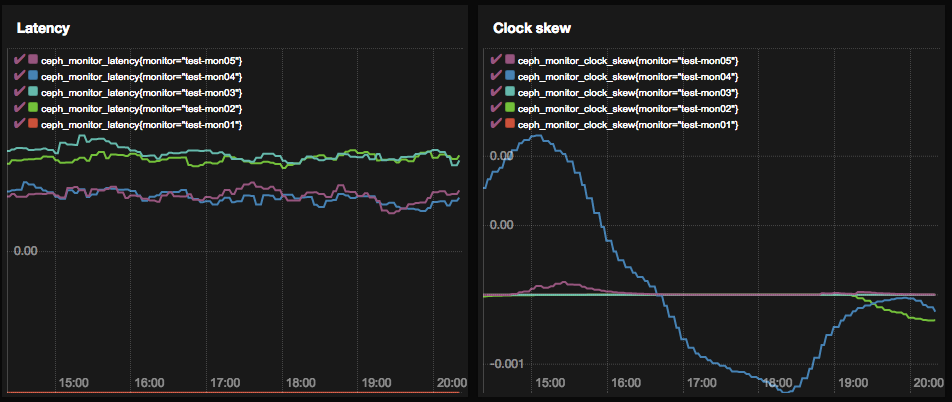
Sample view
If you have promdash set up you can generate views like:
Copyright @ 2016 DigitalOcean™ Inc.
