| .github/workflows | ||
| ceph | ||
| examples | ||
| rados | ||
| .gitignore | ||
| config.go | ||
| CONTRIBUTING.md | ||
| Dockerfile | ||
| exporter.yml | ||
| go.mod | ||
| go.sum | ||
| LICENSE | ||
| main.go | ||
| README.md | ||
| sample.png | ||
Ceph Exporter 


A Prometheus exporter that scrapes meta information about a running Ceph
cluster. All the information gathered from the cluster is done by interacting
with the monitors using an appropriate wrapper over
rados_mon_command(). Hence, no additional setup is necessary other than
having a working Ceph cluster.
Dependencies
You should ideally run this exporter from the client that can talk to the Ceph cluster. Like any other Ceph client, it needs the following files to run correctly.
ceph.confcontaining your Ceph configuration.ceph.<user>.keyringin order to authenticate to your Ceph cluster.
The ceph_exporter will automatically pick those up if they are present in
any of the default
locations. Otherwise
you will need to provide the configuration manually using environment
variables:
CEPH_CLUSTER: cluster's name (defaultceph)CEPH_CONFIG: configuration file that a Ceph client uses to connect to the cluster (default/etc/ceph/ceph.conf)CEPH_USER: a Ceph client user used to connect to the cluster (defaultadmin)
We use Ceph's official Golang client to run commands on the cluster.
This ceph_exporter branch currently supports the Nautilus, Octopus (untested), and Pacific releases. It might
not work as expected with older or non-LTS versions of Ceph.
Environment Variables
| Name | Description | Default |
|---|---|---|
TELEMETRY_ADDR |
Host:Port for ceph_exporter's metrics endpoint | *:9128 |
TELEMETRY_PATH |
URL Path for surfacing metrics to Prometheus | /metrics |
EXPORTER_CONFIG |
Path to ceph_exporter configuration file | /etc/ceph/exporter.yml |
RGW_MODE |
Enable collection of stats from RGW (0:disabled 1:enabled 2:background) | 0 |
CEPH_CLUSTER |
Ceph cluster name | ceph |
CEPH_CONFIG |
Path to Ceph configuration file | /etc/ceph/ceph.conf |
CEPH_USER |
Ceph user to connect to cluster | admin |
CEPH_RADOS_OP_TIMEOUT |
Ceph rados_osd_op_timeout and rados_mon_op_timeout used to contact cluster (0s means no limit) | 30s |
LOG_LEVEL |
Logging level. One of: [trace, debug, info, warn, error, fatal, panic] | info |
TLS_CERT_FILE_PATH |
Path to the x509 certificate file for enabling TLS (the key file path must also be specified) | |
TLS_KEY_FILE_PATH |
Path to the x509 key file for enabling TLS (the cert file path must also be specified) |
Installation
The typical Go way of installing or building should work provided you have the cgo dependencies.
$ go install -tags nautilus
$ go build -o ceph_exporter -tags nautilus
We build the client with support for nautilus specifically but the binary will work for Octopus and Pacific as well.
Docker Image
Docker Hub
The official docker image is available at digitalocean/ceph_exporter.
Build From Source
It is also possible to build your own locally from the source. The port 9128
is exposed as a default port for ceph_exporter.
The exporter needs your Ceph configuration in order to establish communication
with the Ceph monitors. You can either pass it in as an additional command or
mount the directory containing both your ceph.conf and your user's keyring
under the default /etc/ceph location that Ceph checks for.
A sample build command would look like:
$ docker build -t digitalocean/ceph_exporter .
A --build-args TEST=true flag can be added to the build command above to
also run Golang's unit tests during build:
docker build -t digitalocean/ceph_exporter . --build-arg TEST=true --no-cache
You can start running your ceph_exporter container now.
$ docker run -v /etc/ceph:/etc/ceph -p=9128:9128 -it digitalocean/ceph_exporter
You would have to ensure your image can talk over to the monitors. If it needs
access to your host's network stack you might need to add --net=host to the
above command. It makes the port mapping redundant so the -p flag can be
removed.
Point your Prometheus to scrape from :9128 on your host now (or your port
of choice if you decide to change it).
Contributing
Please refer to the CONTRIBUTING guide for more information on how to submit your changes to this repository.
Sample view
See ./examples for a docker-compose file with Grafana if you'd like to
quickly get a test environment up and running.
Link to official documentation explaining docker-compose:
https://docs.docker.com/compose/
The docker-compose file itself has comments on how to change it to adapt to
your environment. It does use volumes in order to persist data. Docker
volumes documentation: https://docs.docker.com/engine/tutorials/dockervolumes/
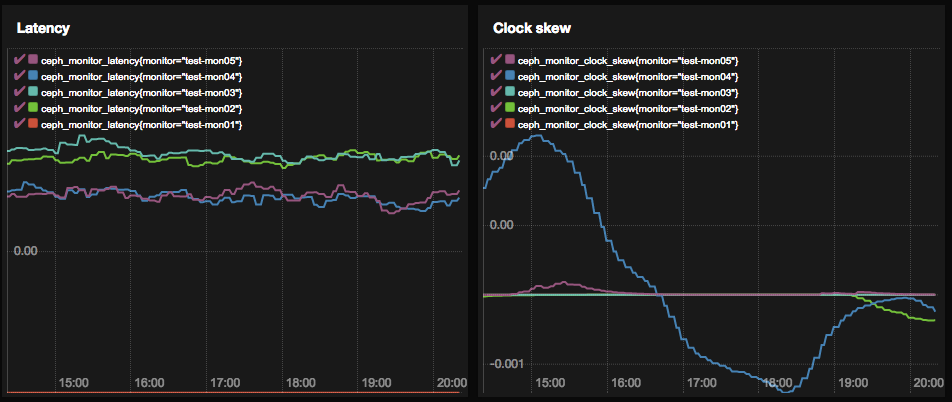
If you have promdash set up you can generate views like:
Copyright @ 2016-2020 DigitalOcean™ Inc.
