2015-12-19 23:45:57 +00:00
# Alertmanager [][travis]
[][circleci]
2016-05-13 19:48:57 +00:00
[][quay]
[][hub]
2015-10-22 12:56:55 +00:00
2016-02-23 16:12:19 +00:00
The Alertmanager handles alerts sent by client applications such as the Prometheus server. It takes care of deduplicating, grouping, and routing them to the correct receiver integration such as email, PagerDuty, or OpsGenie. It also takes care of silencing and inhibition of alerts.
* [Documentation ](http://prometheus.io/docs/alerting/alertmanager/ )
2015-10-22 12:56:55 +00:00
## Installation
2016-03-30 14:05:42 +00:00
### Build dependencies
These dependencies are necessary for building Alertmanager. There are no runtime dependencies, as the resulting binary is statically linked.
2016-01-07 14:15:21 +00:00
Debian family:
sudo apt-get install build-essential libc6-dev
Red Hat family:
2016-01-08 13:59:32 +00:00
sudo yum install glibc-static
2016-01-07 14:15:21 +00:00
### Compiling the binary
2015-10-22 13:25:18 +00:00
The current version has to be run from the repository folder as UI assets and notification templates are not yet statically compiled into the binary.
2015-10-22 12:56:55 +00:00
You can either `go get` it:
```
$ GO15VENDOREXPERIMENT=1 go get github.com/prometheus/alertmanager
2015-10-22 13:25:18 +00:00
# cd $GOPATH/src/github.com/prometheus/alertmanager
2015-10-22 12:56:55 +00:00
$ alertmanager -config.file=< your_file >
```
Or checkout the source code and build manually:
```
$ mkdir -p $GOPATH/src/github.com/prometheus
$ cd $GOPATH/src/github.com/prometheus
$ git clone https://github.com/prometheus/alertmanager.git
$ cd alertmanager
2016-02-02 09:27:20 +00:00
$ make build
2015-10-22 12:56:55 +00:00
$ ./alertmanager -config.file=< your_file >
```
2015-10-22 13:25:18 +00:00
## Example
2016-06-14 09:03:49 +00:00
This is an example configuration that should cover most relevant aspects of the new YAML configuration format. The full documentation of the configuration can be found [here ](https://prometheus.io/docs/alerting/configuration/ ).
2015-10-22 13:25:18 +00:00
2015-10-22 13:48:50 +00:00
```yaml
2015-10-22 13:25:18 +00:00
global:
# The smarthost and SMTP sender used for mail notifications.
2015-11-20 14:10:38 +00:00
smtp_smarthost: 'localhost:25'
smtp_from: 'alertmanager@example.org'
2015-10-22 13:25:18 +00:00
# The root route on which each incoming alert enters.
route:
2016-01-28 13:02:15 +00:00
# The root route must not have any matchers as it is the entry point for
# all alerts. It needs to have a receiver configured so alerts that do not
# match any of the sub-routes are sent to someone.
receiver: 'team-X-mails'
2015-10-22 13:25:18 +00:00
# The labels by which incoming alerts are grouped together. For example,
# multiple alerts coming in for cluster=A and alertname=LatencyHigh would
# be batched into a single group.
group_by: ['alertname', 'cluster']
2015-12-19 23:45:57 +00:00
2015-10-22 13:25:18 +00:00
# When a new group of alerts is created by an incoming alert, wait at
# least 'group_wait' to send the initial notification.
# This way ensures that you get multiple alerts for the same group that start
2015-12-19 23:45:57 +00:00
# firing shortly after another are batched together on the first
2015-10-22 13:25:18 +00:00
# notification.
group_wait: 30s
2016-01-28 12:25:09 +00:00
# When the first notification was sent, wait 'group_interval' to send a batch
2015-10-22 13:25:18 +00:00
# of new alerts that started firing for that group.
group_interval: 5m
# If an alert has successfully been sent, wait 'repeat_interval' to
# resend them.
2015-12-19 23:45:57 +00:00
repeat_interval: 3h
2015-10-22 13:25:18 +00:00
# All the above attributes are inherited by all child routes and can
# overwritten on each.
# The child route trees.
routes:
# This routes performs a regular expression match on alert labels to
# catch alerts that are related to a list of services.
- match_re:
service: ^(foo1|foo2|baz)$
2015-11-10 13:08:20 +00:00
receiver: team-X-mails
2015-10-22 12:56:55 +00:00
2015-10-22 13:25:18 +00:00
# The service has a sub-route for critical alerts, any alerts
# that do not match, i.e. severity != critical, fall-back to the
# parent node and are sent to 'team-X-mails'
routes:
- match:
severity: critical
2015-11-10 13:08:20 +00:00
receiver: team-X-pager
2015-10-22 13:25:18 +00:00
- match:
service: files
2015-11-10 13:08:20 +00:00
receiver: team-Y-mails
2015-10-22 13:25:18 +00:00
routes:
- match:
severity: critical
2015-11-10 13:08:20 +00:00
receiver: team-Y-pager
2015-10-22 13:25:18 +00:00
# This route handles all alerts coming from a database service. If there's
2015-10-22 13:29:36 +00:00
# no team to handle it, it defaults to the DB team.
2015-10-22 13:25:18 +00:00
- match:
service: database
2015-11-10 13:08:20 +00:00
receiver: team-DB-pager
2015-10-22 13:25:18 +00:00
# Also group alerts by affected database.
group_by: [alertname, cluster, database]
routes:
- match:
owner: team-X
2015-11-10 13:08:20 +00:00
receiver: team-X-pager
2015-10-22 13:25:18 +00:00
- match:
owner: team-Y
2015-11-10 13:08:20 +00:00
receiver: team-Y-pager
2015-10-22 13:25:18 +00:00
# Inhibition rules allow to mute a set of alerts given that another alert is
# firing.
2015-12-19 23:45:57 +00:00
# We use this to mute any warning-level notifications if the same alert is
2015-10-22 13:25:18 +00:00
# already critical.
inhibit_rules:
- source_match:
severity: 'critical'
target_match:
severity: 'warning'
# Apply inhibition if the alertname is the same.
equal: ['alertname']
2015-11-10 13:08:20 +00:00
receivers:
2015-10-22 13:25:18 +00:00
- name: 'team-X-mails'
email_configs:
2015-11-20 14:10:38 +00:00
- to: 'team-X+alerts@example.org'
2015-10-22 13:25:18 +00:00
- name: 'team-X-pager'
email_configs:
2015-11-20 14:10:38 +00:00
- to: 'team-X+alerts-critical@example.org'
2015-10-22 13:25:18 +00:00
pagerduty_configs:
- service_key: < team-X-key >
- name: 'team-Y-mails'
email_configs:
2015-11-20 14:10:38 +00:00
- to: 'team-Y+alerts@example.org'
2015-10-22 13:25:18 +00:00
- name: 'team-Y-pager'
pagerduty_configs:
- service_key: < team-Y-key >
- name: 'team-DB-pager'
pagerduty_configs:
- service_key: < team-DB-key >
```
2015-10-22 12:56:55 +00:00
2015-10-22 13:34:24 +00:00
## Testing
If you want to test the new Alertmanager while running the current version, you can mirror traffic to the new one with a simple nginx configuration similar to this:
```
server {
server_name < your_current_alertmanager > ;
location / {
proxy_pass http://localhost:9093;
post_action @forward ;
}
location @forward {
2015-12-19 23:45:57 +00:00
proxy_pass http://< your_new_alertmanager > :9093;
2015-10-22 13:34:24 +00:00
}
}
```
2015-10-26 14:11:14 +00:00
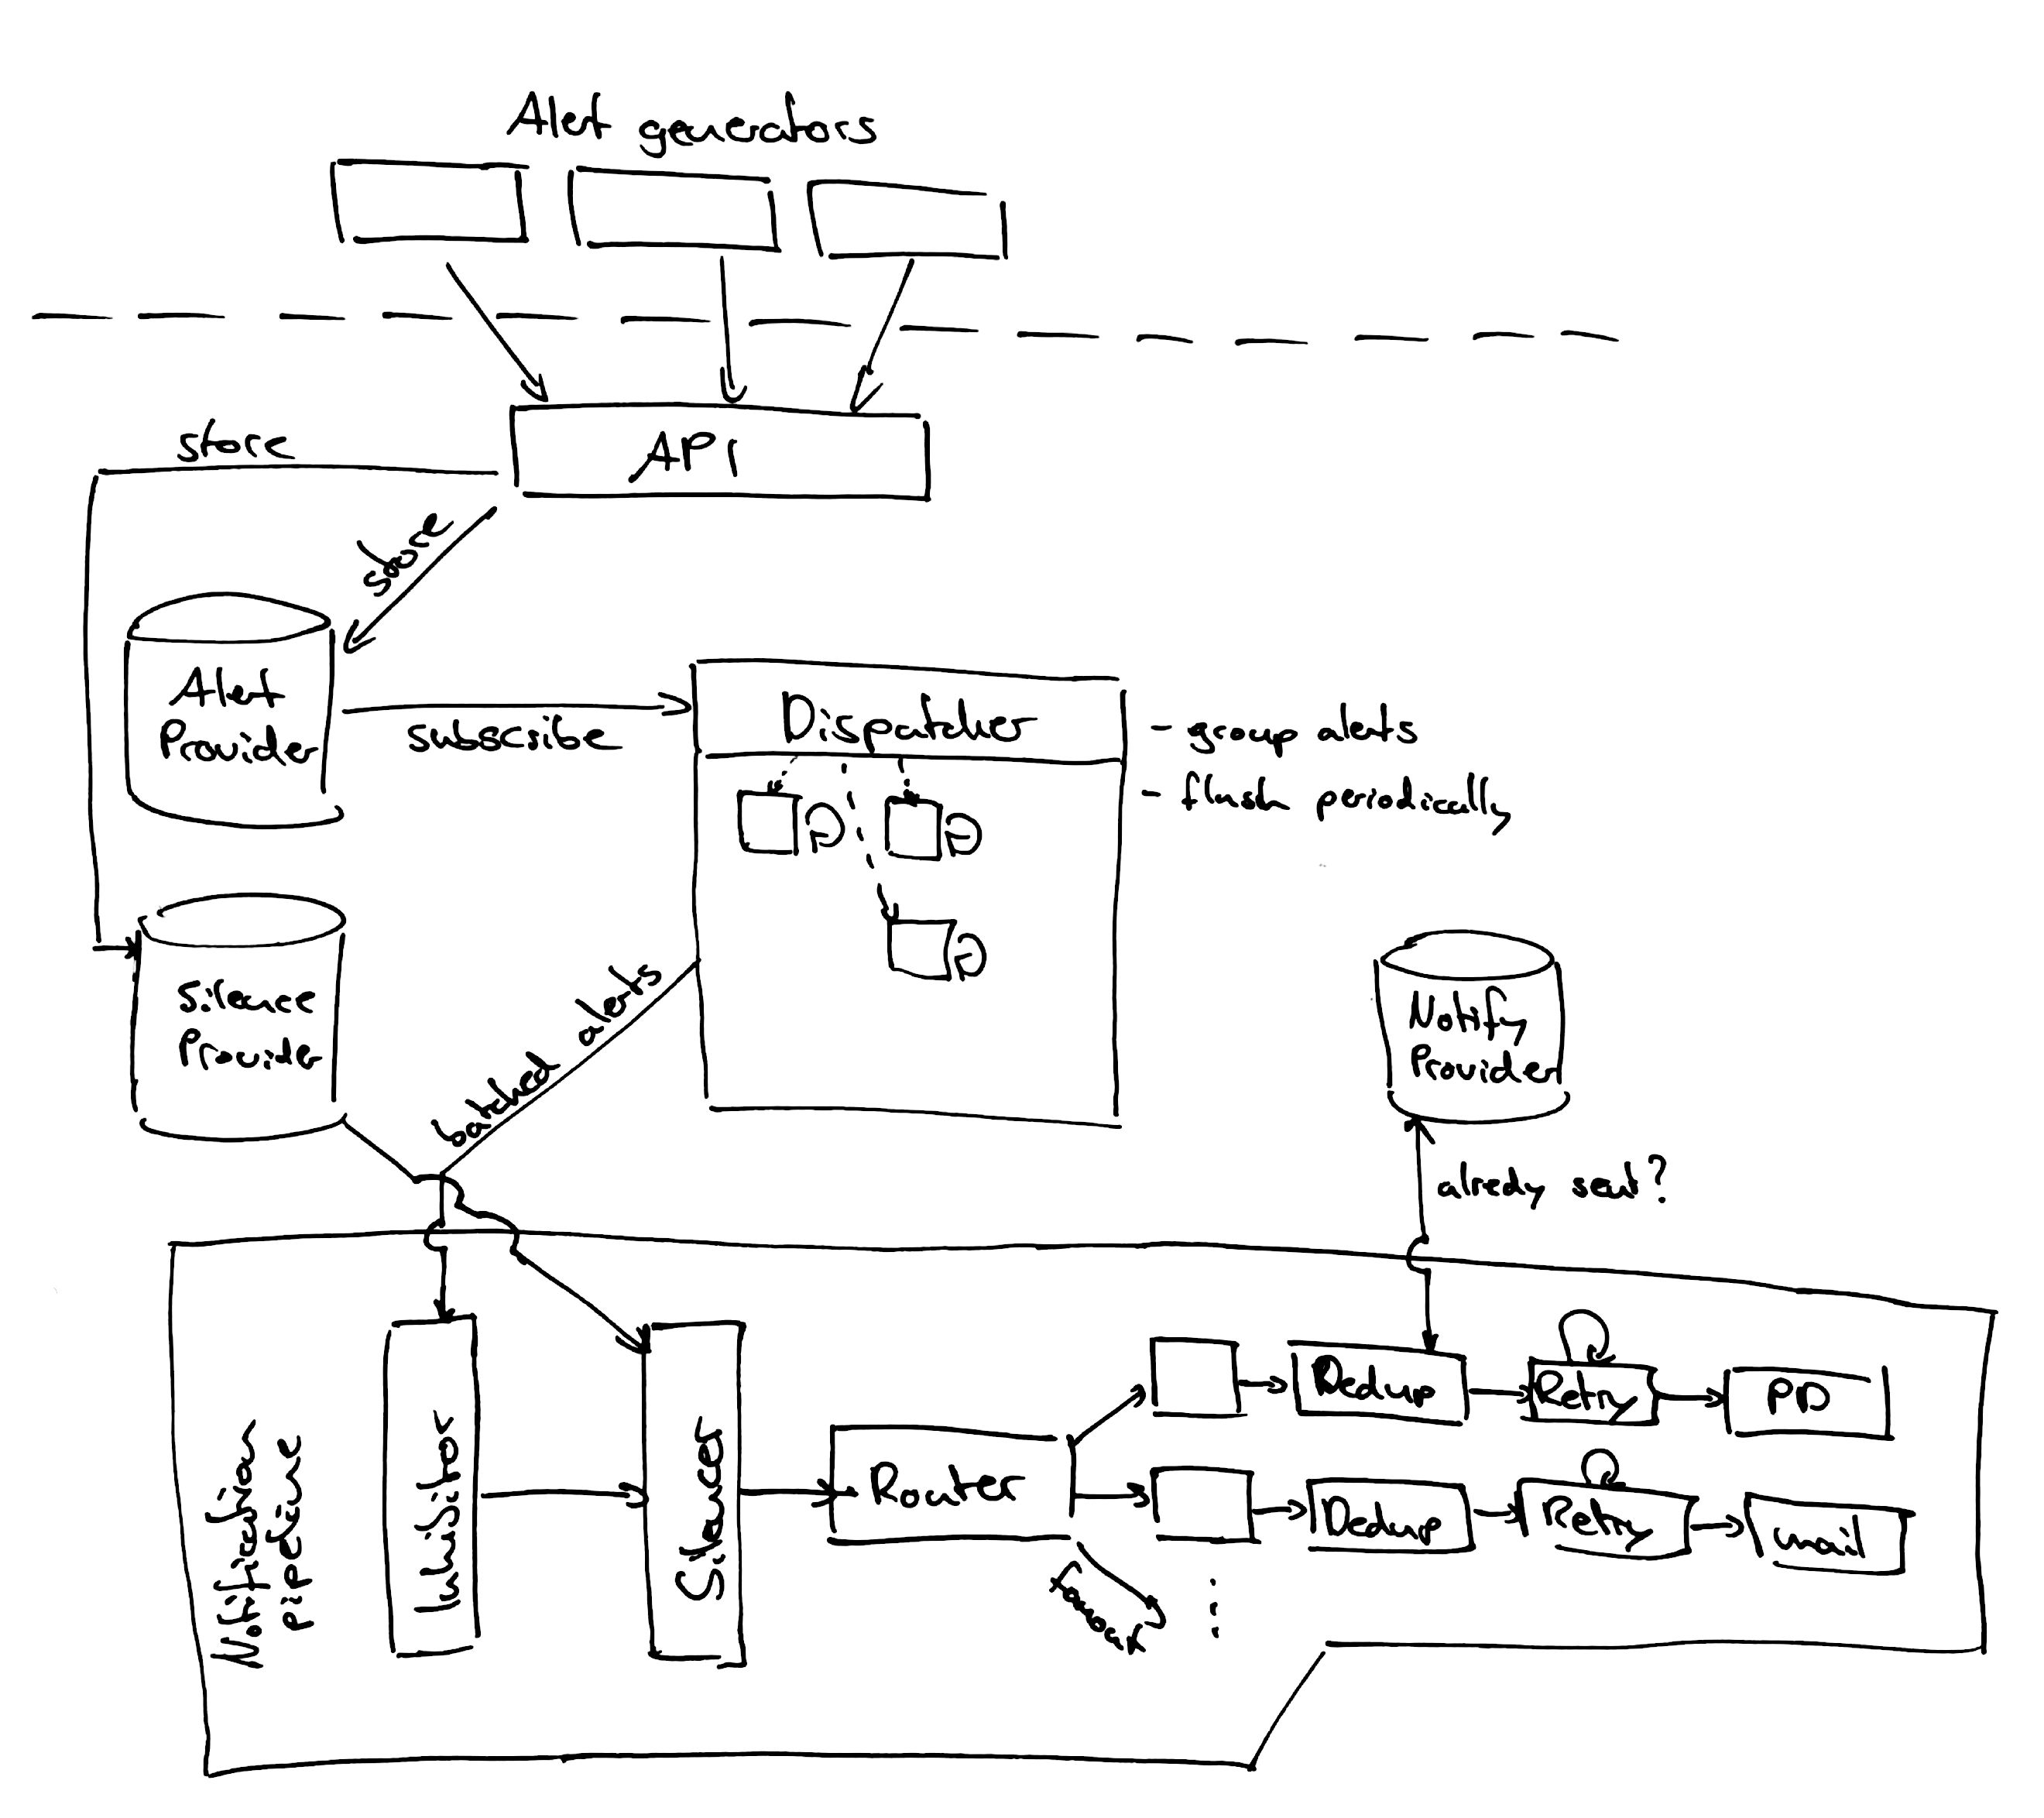
## Architecture

2015-10-22 12:56:55 +00:00
2015-12-19 23:45:57 +00:00
[travis]: https://travis-ci.org/prometheus/alertmanager
[hub]: https://hub.docker.com/r/prom/alertmanager/
[circleci]: https://circleci.com/gh/prometheus/alertmanager
2016-05-13 19:48:57 +00:00
[quay]: https://quay.io/repository/prometheus/alertmanager